Local teachers, CMU’s Create Lab bring data and technical fluency into classrooms
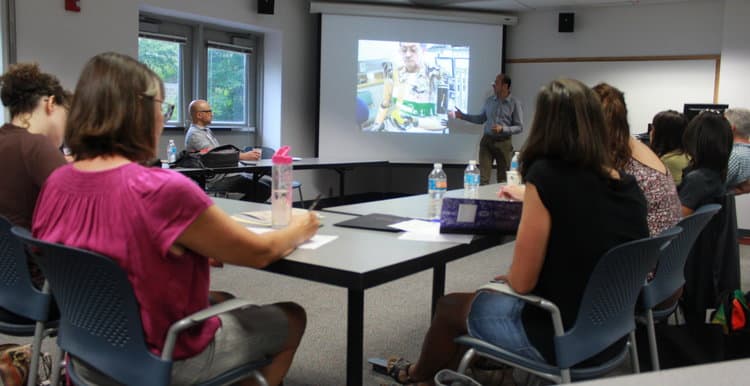
This past summer, Carnegie Mellon University researchers and local teachers played with maps of Pittsburgh’s public bus routes as an experiment in visualizing so-called big data. The two-week residency prepared teachers to take the big data movement — datasets so large or complex that traditional processing applications are inadequate — into classrooms for the current school year through the new Fluency project.
The depiction of transportation patterns – vibrant eye-catching displays developed at CMU Robotics Institute’s CREATE Lab – that the teachers created last summer were early steps toward data fluency for local students.
The nascent Fluency project recently launched as a one-year pilot in nine schools throughout Allegheny County, with 12 local teachers testing the data projects they designed during their summer residencies at The Community Robotics, Education and Technology Empowerment (CREATE) Lab.
The Fluency project encourages inquiry, narrative and advocacy in the classroom, combining large datasets like vehicle locations along Pittsburgh’s congested bus routes with conventional storytelling.
For example, the patterns of every bus servicing four Pittsburgh routes generated a dataset of 1.5 million records of timestamped bus locations for a single month. The bus sequences told the story of city buses that tend to “bunch,” or cluster, arriving in pairs after a long delay along certain routes.
Another dataset students are using includes statistics from the U.S. Census and data from the Pew Research Center. Jennifer Lanas, who teaches cultural literacy at Holy Family Academy in Emsworth, has already begun incorporating these figures into a curriculum that examines racial perceptions in the United States.
“My students can use this data to present a case from their teenage perspective, and they also are able to form an opinion about society,” Lanas says, explaining that the data fluency work ties in with a novel the students are reading, “How It Went Down” by Kekla Magoon. The novel, about the shooting of an unarmed African-American teenager, gave Lanas’ students a closer look into racial violence and inner-city crime.

“They’re taking a hard look at society’s response to the deaths of unarmed African-American teenagers,” Lanas says. “The idea is to make sure we’re treating these issues with sincerity, with honesty, so our students can speak their truth, but we can also examine the facts of that.”
Led by CMU and supported by The Heinz Endowments, the Fluency project aims to teach students data fluency: how to sift and sort ideas, then reproduce that data in a way that develops students as information producers rather than consumers, according to MaryLu Hutchins of the CREATE Lab.
“We are enabling students to come up with an idea, to pursue that through research,” Hutchins says. “The presentation of that concept and the data that backs it up can be attention-grabbing to a variety of audiences because it can be presented in 20 different ways.”
For example, the complexity of bus route information over a span of decades provides a good prototype for data visualization. Users can filter for stops, schedules, the cost of an individual line or the entire system. They can layer in geospatial Census data to see, for instance, how many people live below the poverty line in a certain corridor.
Teachers from a cross-section of disciplines — from high-school physics and literature departments to librarians and health teachers — are involved in the Fluency project to ensure creativity and open-ended inquiry, Hutchens says. The teachers represent the Pittsburgh, Quaker Valley, Plum, Freeport, Carlynton, Allegheny Valley and Bethel Park school districts and the Holy Family Academy, a Catholic high school.
The Fluency group will use a 14-month, $593,000 planning grant from The Heinz Endowments to develop a pilot program for local schools. Scheduled for fall 2017, the pilot will focus on tools for students in kindergarten through grade 12 to use technology and data to ask questions about their environment, tell stories and articulate arguments.
In addition to bus routes, Hutchins says some of the group’s data maps track immigration and emigration patterns and use virtual reality programming to examine the living conditions of different global populations.
CREATE Lab Project Manager Jessica Kaminsky, part of the outreach team that will support the Fluency teachers, says the project aims to determine the difference between consumer and producer and to measure data fluency.
“The thing that excites me is … the concept of inquiry and manipulation and being comfortable in that process that is going to make successful students in the future,” Kaminsky says.
Students will first create their own graphic representations based on information that’s readily available, such as data on bus routes or the immigration of Syrian refugees, Lanas says.
“A lot of our work initially will focus on creating infographics, ways of making big data understandable to others in a format that gives our students ownership,” Lanas says, explaining what a data consumer is.
But next semester, Lanas’ students will become data producers, using Speck air quality sensors to measure their environment and produce data. The goal is for the students to use the data they’ve produced to write curriculum for students to use in other countries, Lanas says.
Lanas explains that fostering a sense of inquiry begins with a safe classroom environment where students are encouraged to dig deep and manipulate data in a way that others can understand.
Armed with the ability to create a representation with data, Lanas says, students take on the role of teachers.
“If we start with student voice and choice with inquiry, we encourage students to follow their curiosity,” Lanas says.

